Add portfolio records through manual entry or reviewed file imports.
Skip to contentData you choose Client-controlled access Evidence-linked AI You control delivery 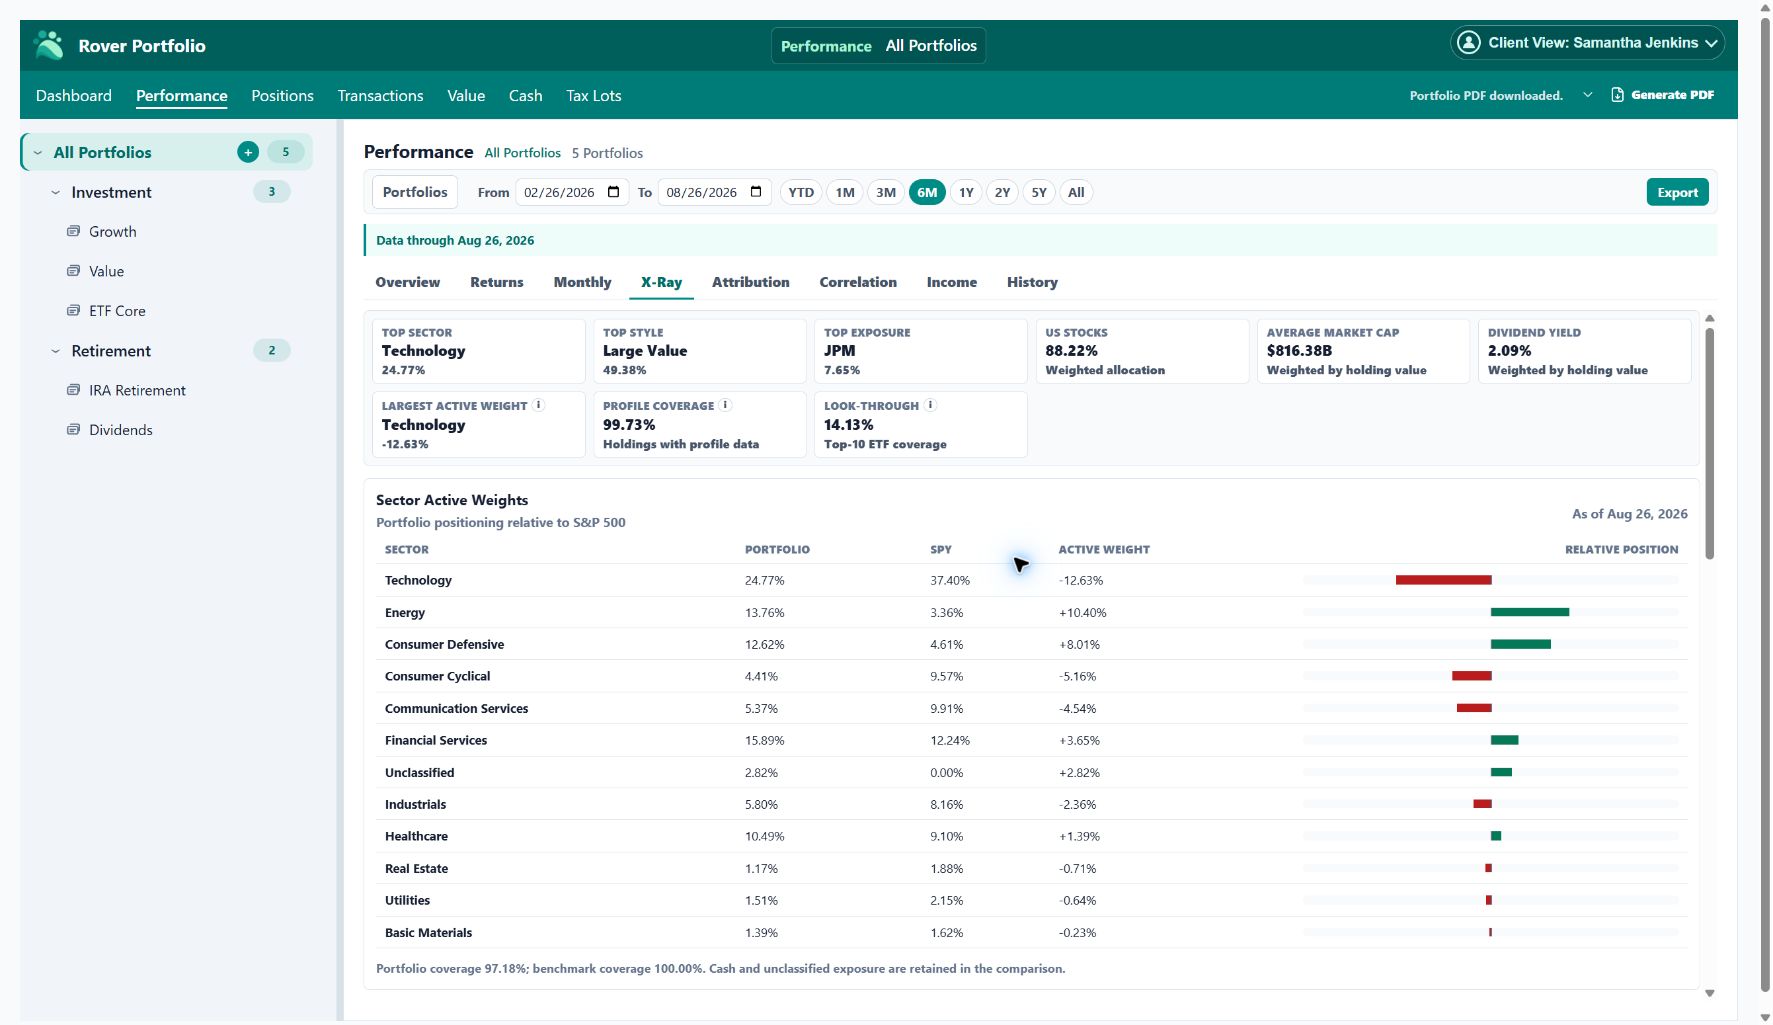
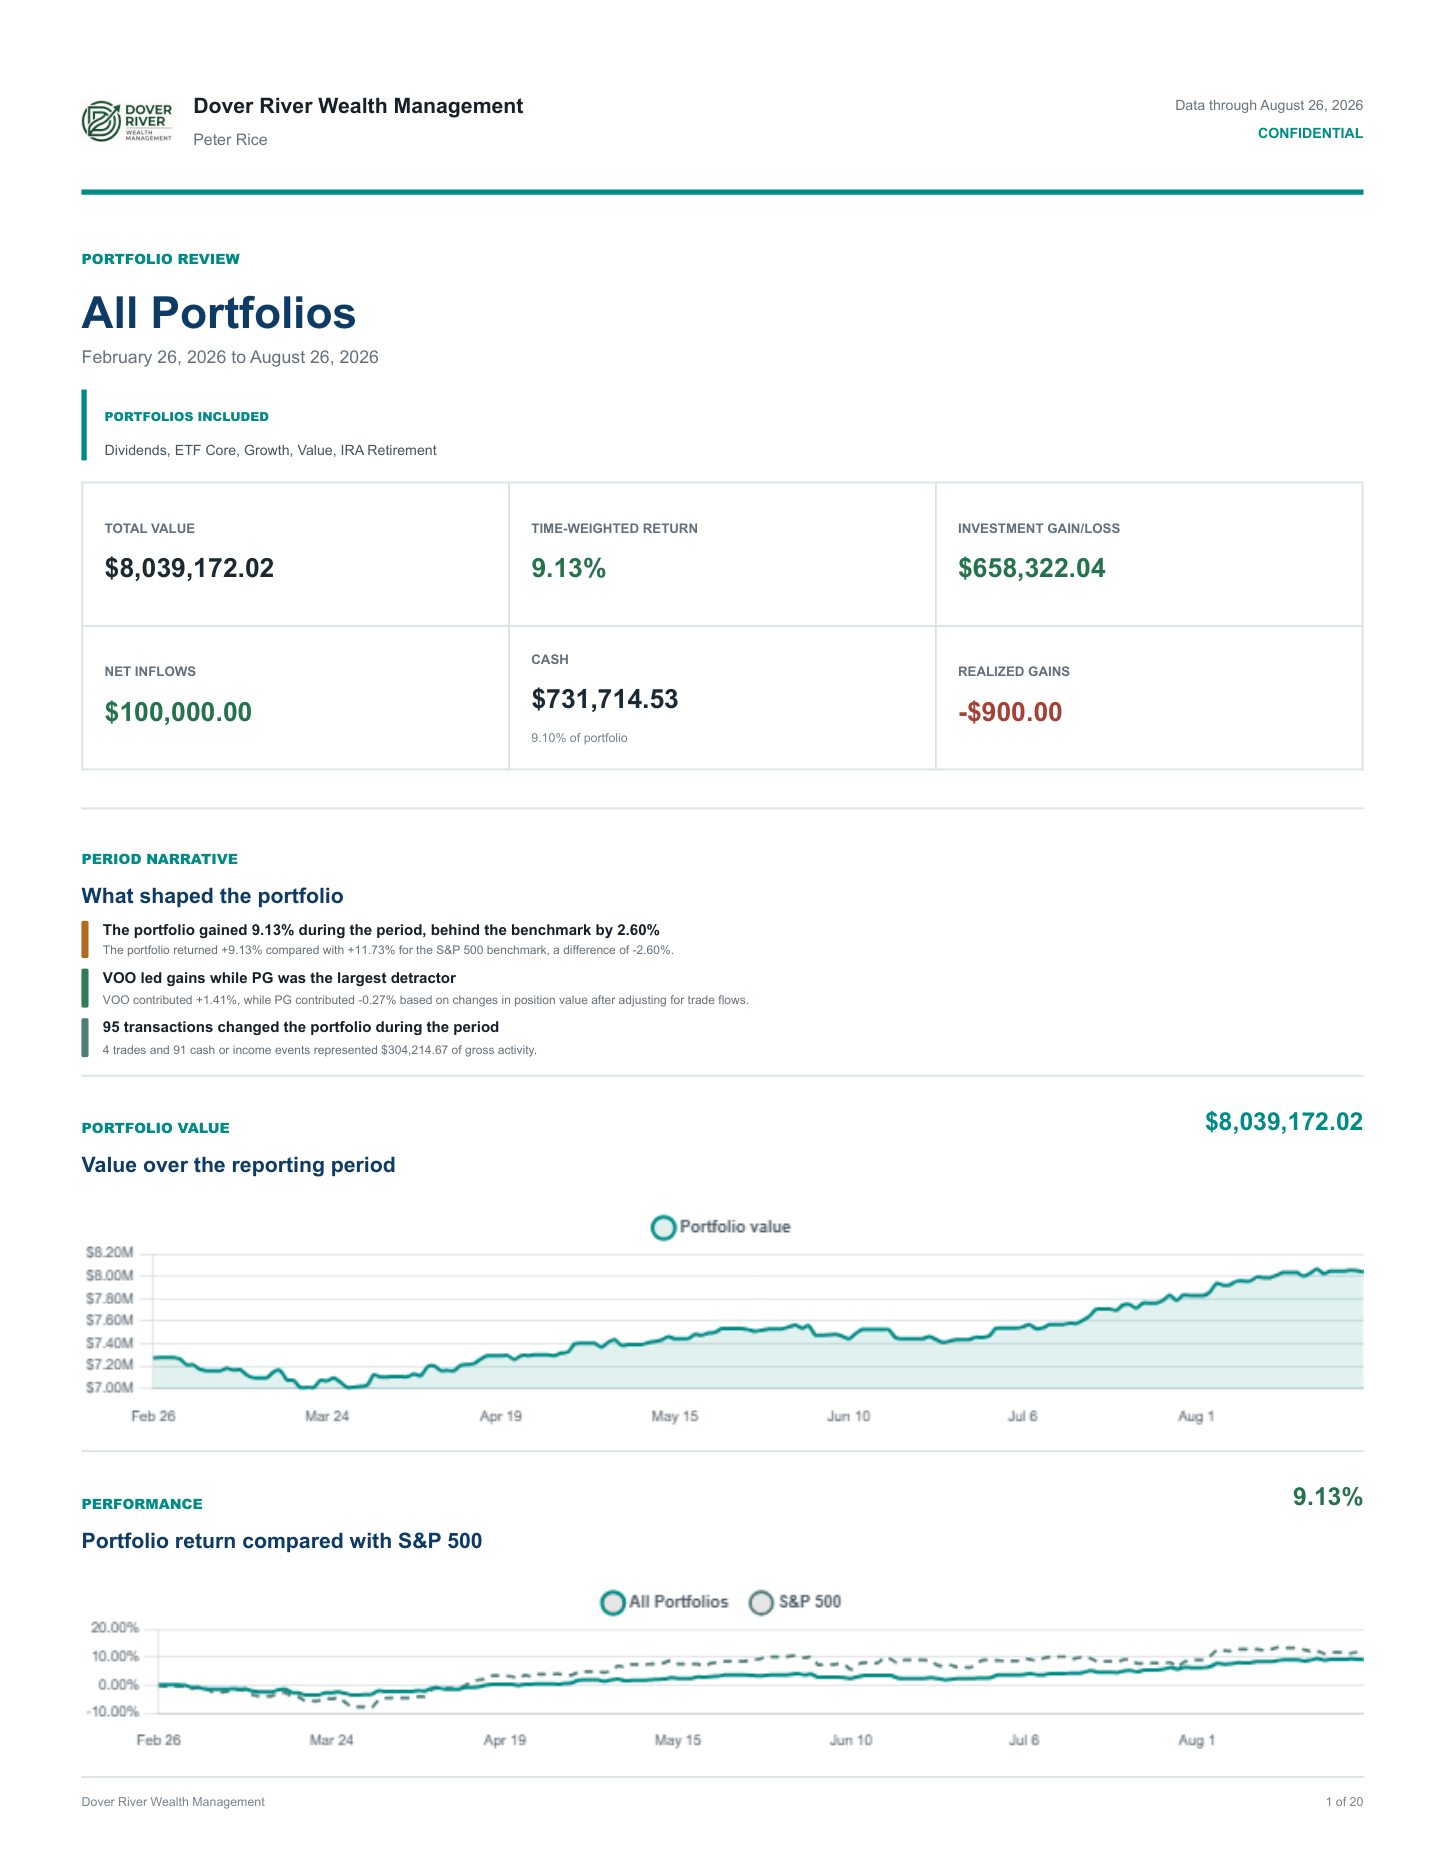 Open the full 20-page report ↗
Spend less time assembling the picture.
Portfolio intelligence, grounded in your records
Ask your portfolio better questions. Get grounded answers.
One accurate view of your portfolios, transactions, cash flows, performance results, and tax lots—with AI available to help explain what it means. Surface the risks, opportunities, and next steps that matter, backed by the underlying evidence.
Analysis and planning only—Rover Portfolio does not hold assets or place trades
Advisor access begins only when a client creates and shares a one-time link.
Analyses connect findings to supporting portfolio evidence and relevant limitations.
Reports are created for your review and exported or shared only when you choose.
For Investors
Your investments tell a story.The data should, too.
Brokerage statements tell you what happened. Rover Portfolio helps you understand why—connecting market movement, cash flows, holdings, and realized activity in one coherent picture, whether you are looking at a single portfolio or a whole folder.
See how the pieces connect →Inside Rover Portfolio
See the story behind your portfolio
Go beyond balances and basic charts. Rover Portfolio connects what you own, what changed, how you performed, and the tax consequences of potential decisions.
01 Portfolio X-Ray
See what you actually own
Look through funds and accounts to uncover overlapping holdings, sector exposure, and concentration risk.
Compare portfolio weights with a benchmark and trace direct and fund-held exposure back to the underlying securities.02 Performance evidence
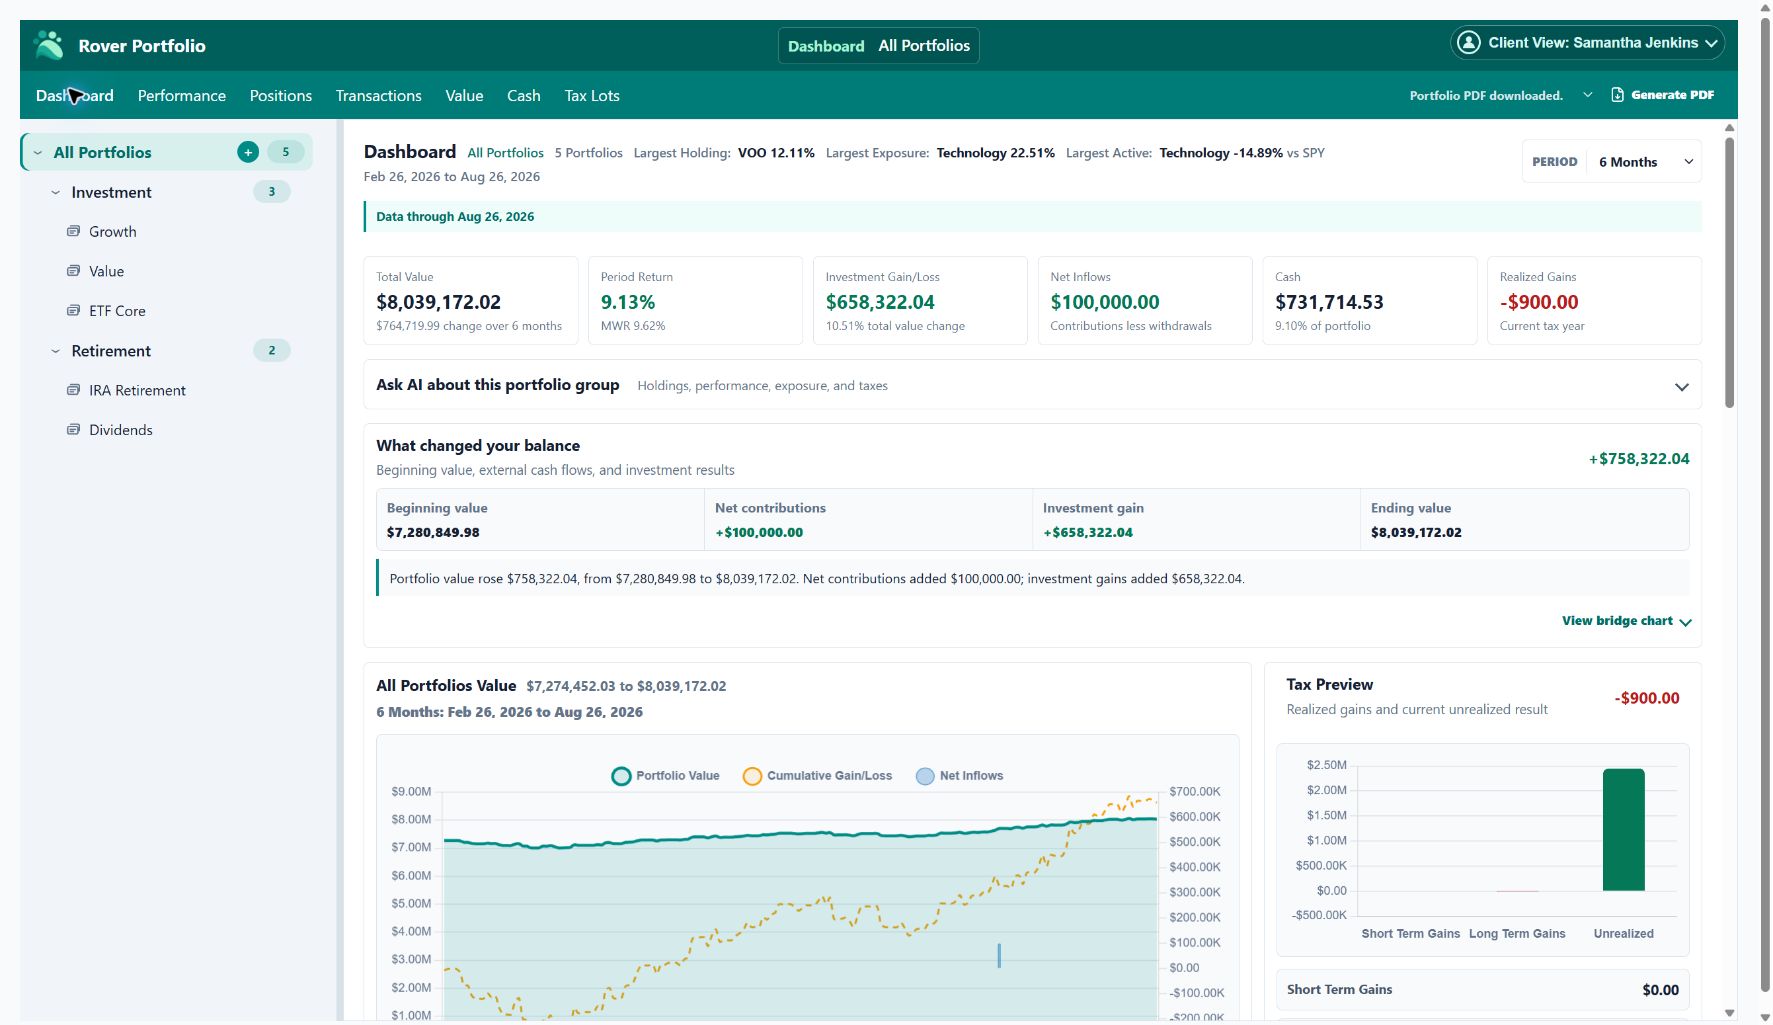
Understand what drove performance
Connect returns to holdings, allocation, benchmarks, cash flows, and the investments that shaped the result.
Move from the period result to its balance bridge, benchmark context, contributors, and supporting portfolio records.03 Tax Lots
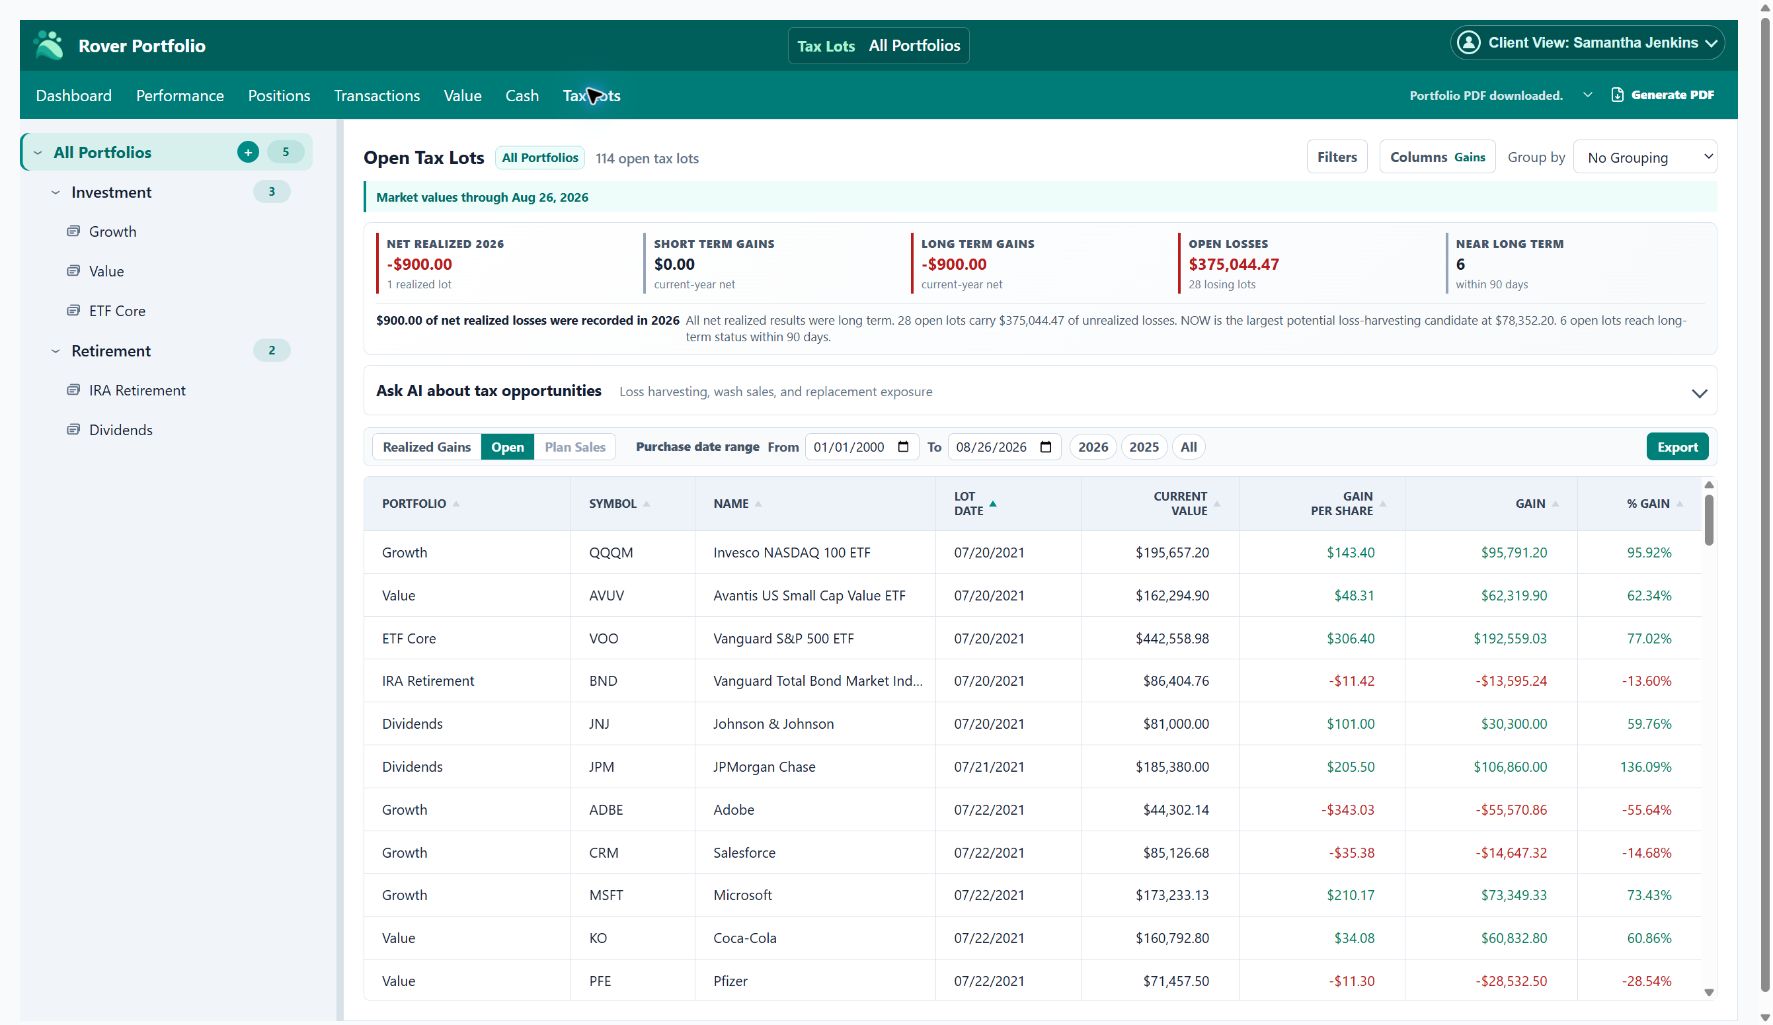
Plan taxable decisions before acting
Compare tax lots and matching policies to estimate gains and losses before you sell.
Review holding periods and open gains or losses, then use Plan Sales to test quantities and cost-basis choices.For Advisors
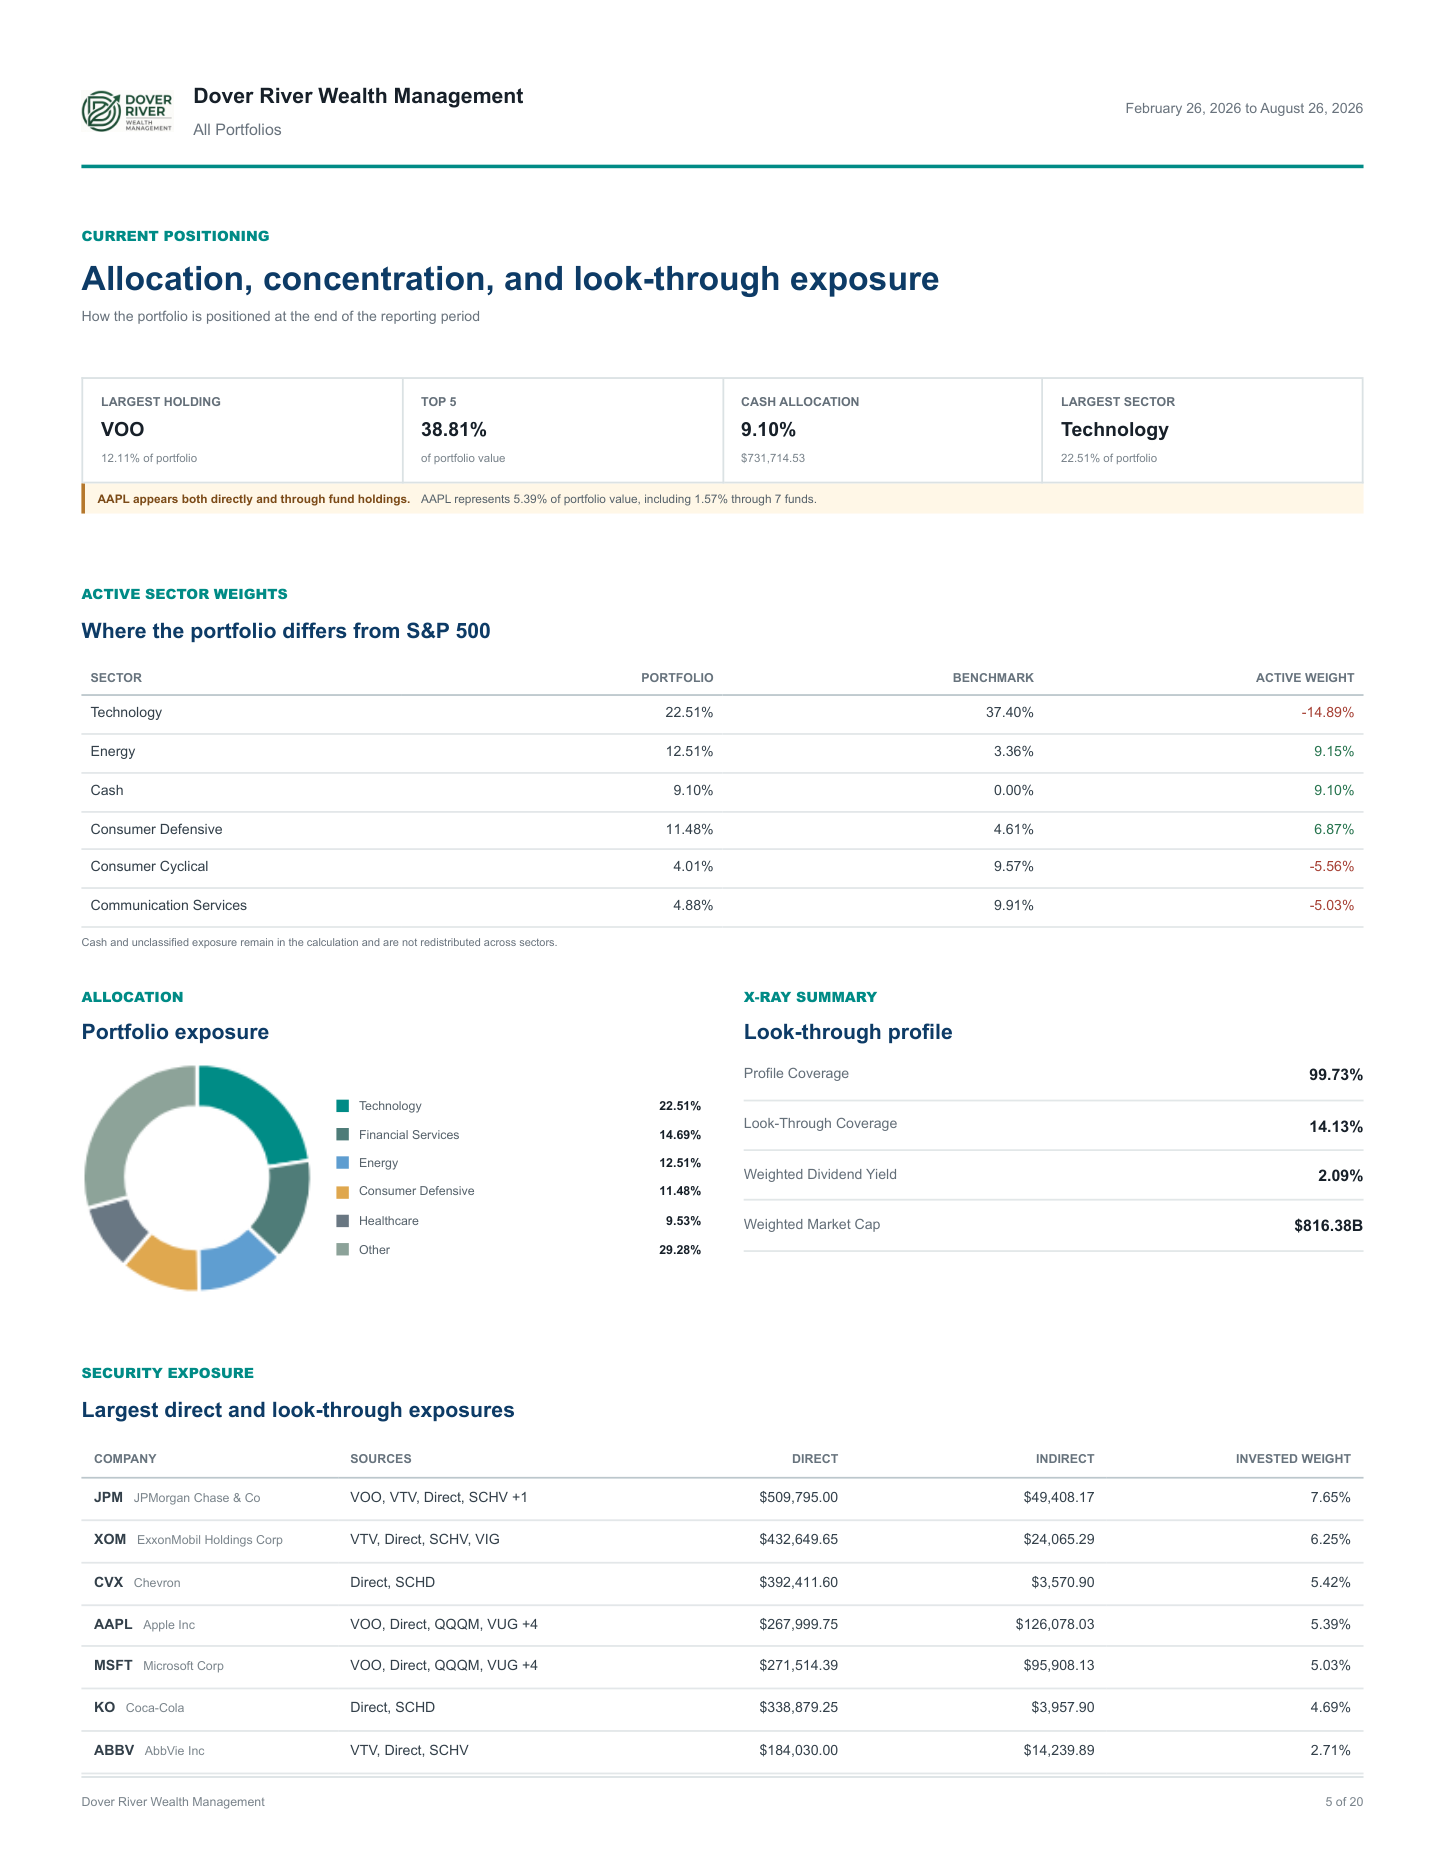
A client-ready portfolio review
Turn portfolio evidence into a clear, firm-branded review prepared for the next client conversation.
- Firm-branded presentationAdvisor identity and disclosures
- Clear portfolio observationsEvidence beside each finding
- Performance in contextPortfolio, benchmark, and cash flows
Open the full 20-page report ↗Portfolio evidence, ready for the conversation.
Observations and supporting evidence · Performance and benchmark context · Advisor identity and disclosures
01
ConnectClient-controlled account linking
02
AnalyzeAI-assisted portfolio and household intelligence
03
ExplainPlain-language observations
04
DeliverFirm-branded portfolio reviews
Resources
Clarity shouldn’t stop at the interface.
Friendly guidance for learning the workspace, preparing portfolio data, understanding the new Performance summary, and seeing exactly how the numbers are calculated.
First Steps
Browse all resources →Getting Started
A quick tour of the workspace and a practical first workflow.
Read guide →Data SetupImport Portfolio Data
Prepare position and transaction files that import cleanly.
Read guide →MethodologyDashboard Calculations
Understand the numbers behind every Dashboard tile and chart.
Read guide →PerformancePerformance Summary Terms
Decode Sharpe ratio, upside and downside capture, drawdowns, volatility, and attribution.
Read guide →Data ReferenceTransaction Rules
Review accounting signs, validation, duplicates, and identifiers.
Read guide →
A clearer portfolio starts here